Estimate how often two study positions are both recalled on the same trial.
Co-recall by lag (CoRec) estimates the probability that two study positions separated by lag \(d\) are both recalled on the same trial, ignoring recall order. For each positive lag, the analysis counts the number of co-recalled pairs and divides by the total number of pairs at that lag.
\[\text{CoRec}(d) = \frac{\sum_t \text{co-recalled pairs at lag } d}{\sum_t \text{possible pairs at lag } d}\]
Unlike conditional co-recall, the denominator here is the total number of possible pairs at each lag regardless of whether the anchor was recalled. This makes CoRec a joint probability measure rather than a conditional one.
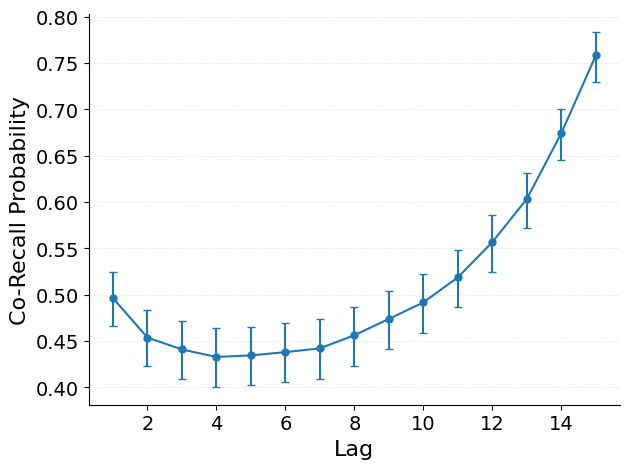
The x-axis shows study lag and the y-axis shows the joint probability that both positions were recalled. Key patterns:
Declining with lag: nearby study positions are more likely to be co-recalled, reflecting temporal clustering.
Comparison with conditional co-recall: joint co-recall reflects both baseline recall rates and associative clustering, making it sensitive to overall recall level.
API Details### Notebook parameters- data_path — path to an HDF5 file containing a RecallDataset.- figure_dir — directory for saving figures.- figure_str — base filename for the saved figure. Leave empty to display without saving.- ylim — y-axis limits as a tuple, or None for automatic scaling.- trial_query — a Python expression evaluated against the dataset to select trials.- max_lag — maximum lag to display, or None to use all available lags.- confidence_level — confidence level for subject-wise error bars.To compare across datasets, re-run with different data_path and trial_query values. For example, LohnasKahana2014.h5 uses trial_query = "data['list_type'] == 1" and ylim = [.1, .26], while HealeyKahana2014.h5 uses trial_query = "data['listtype'] == -1" and ylim = [.1, .53].