Quantify the spacing effect: how recall improves with wider repetition spacing.
The spacing effect is a well-established memory phenomenon: repeated items benefit from wider spacing between presentations. Recall probability by lag (RPL) quantifies this by computing recall rate as a function of the number of intervening items between repeated presentations.
Two display modes are available: binned groups lags into coarse intervals (0, 1–2, 3–5, 6–8) for visualization, while full shows every lag bucket individually.
Workflow
Code
import matplotlib.pyplot as pltimport osfrom jaxcmr.analyses.rpl import (from jaxcmr.helpers import find_project_root, generate_trial_mask, load_data, save_figurefrom jaxcmr.repetition import make_control_dataset
Code
= "data/LohnasKahana2014.h5" = "results/figures" = "" = None = "data['list_type'] > 2" = "data['list_type'] == 1" = 10 = "full" = 0.95
Code
= find_project_root()= os.path.join(project_root, figure_dir)= os.path.join(project_root, data_path)= load_data(data_path)= generate_trial_mask(data, mixed_trial_query)= make_control_dataset(data, mixed_trial_query, control_trial_query, control_shuffles)= generate_trial_mask(control_dataset, mixed_trial_query)= infer_max_lag(data['pres_itemnos' ], data['pres_itemnos' ].shape[1 ])= plot_rpl if mode == "binned" else plot_full_rpl= subject_binned_rpl if mode == "binned" else subject_full_rpl
Code
= ["Mixed" , "Control" ],= "source" ,= confidence_level,if ylim is not None :for ax in plt.gcf().axes:
Code
= run_rpl_slope_analysis(= mode, max_lag= max_lag,print ("=" * 60 )print ("Spacing Effect Slope: Observed" )print ("=" * 60 )print (observed_result)print (" \n " + "=" * 60 )print ("Spacing Effect Slope: Control" )print ("=" * 60 )print (control_result)print (" \n " + "=" * 70 )print ("Observed vs Control: Spacing Effect Slope" )print ("=" * 70 )print (comparison_result)
============================================================
Spacing Effect Slope: Observed
============================================================
N=35
Mean slope: 0.0186
t-stat: 5.644 p=0.0000
W-stat: 65.0 p=0.0000

============================================================
Spacing Effect Slope: Control
============================================================
N=35
Mean slope: 0.0036
t-stat: 2.800 p=0.0084
W-stat: 148.0 p=0.0053

======================================================================
Observed vs Control: Spacing Effect Slope
======================================================================
N=35
Mean slope (observed): 0.0186
Mean slope (comparison): 0.0036
Mean difference: 0.0150
t-stat: 4.058 p=0.0003
W-stat: 105.0 p=0.0003
Interpretation
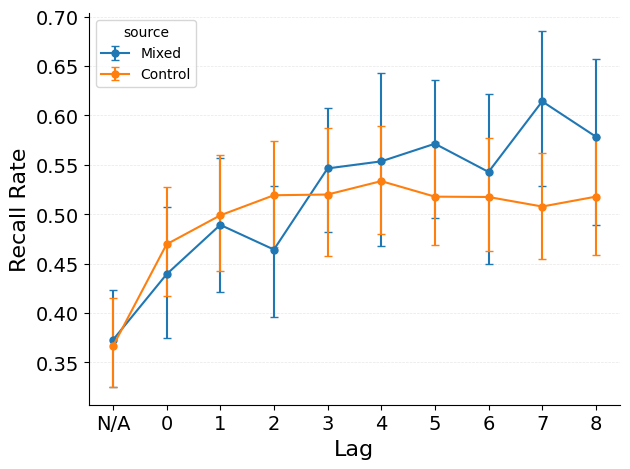
The plot shows recall probability as a function of repetition spacing (number of intervening items) for both observed and control data. Key patterns:
Positive slope : recall probability increases with wider spacing, demonstrating the spacing effect.Observed > Control : the spacing benefit exceeds what shuffled position assignments would produce.Slope tests : the statistical tests quantify whether the spacing slope is reliably positive and whether it differs between observed and control.
API Details
Notebook parameters
data_path — path to an HDF5 file containing a RecallDataset.figure_dir — directory for saving figures.figure_str — base filename for the saved figure. Leave empty to display without saving.ylim — y-axis limits as a list, or None for automatic scaling.mixed_trial_query — query selecting trials with repeated items.control_trial_query — query selecting trials for the control.control_shuffles — number of shuffle iterations for building the control dataset.mode — "binned" for coarse lag groups or "full" for individual lag buckets.confidence_level — confidence level for subject-wise error bars.