Repetition-Neighbor Lag-CRP

Examine transitions between neighbors of different presentations of repeated items.

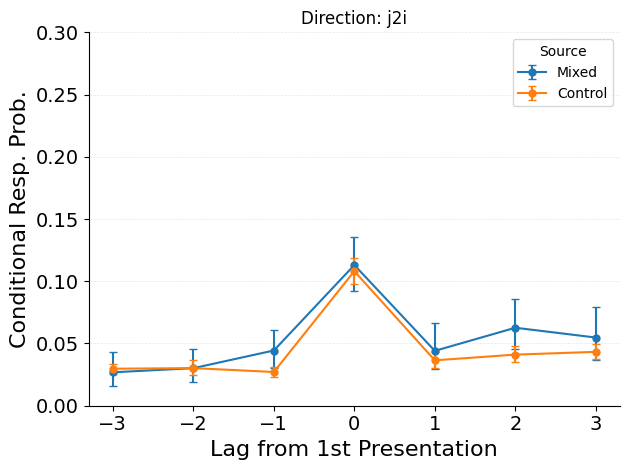
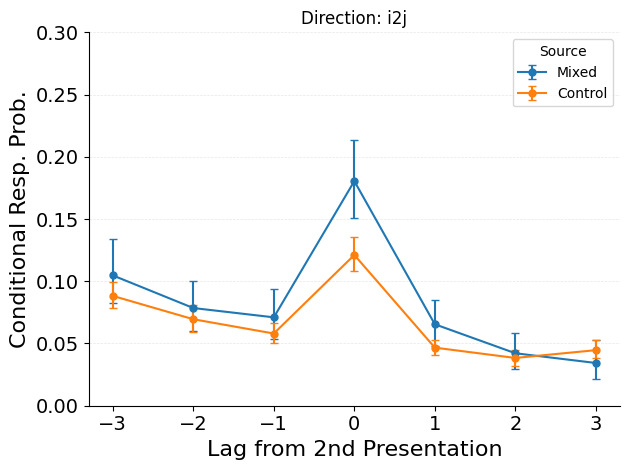
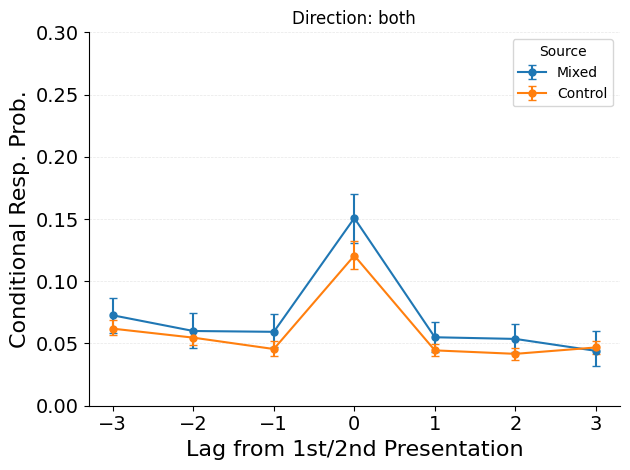
The repetition-neighbor CRP analysis examines transitions between items studied near different presentations of the same repeated item. For a repeated item at positions \(i\) and \(j\), the analysis tracks transitions from \(j\)’s neighbors to \(i\)’s neighborhood (j2i), from \(i\)’s neighbors to \(j\)’s neighborhood (i2j), or both.

These cross-occurrence neighbor transitions test whether recalling items near one presentation of a repeated item facilitates transitions to items near the other presentation.

Workflow

Code
import os

import matplotlib.pyplot as plt

from jaxcmr.analyses.repneighborcrp import (
    plot_rep_neighbor_crp,
    subject_rep_neighbor_crp,
    test_rep_neighbor_crp_vs_control,
)
from jaxcmr.helpers import find_project_root, generate_trial_mask, load_data, save_figure
from jaxcmr.repetition import make_control_dataset
Code
data_path = "data/LohnasKahana2014.h5"
figure_dir = "results/figures"
figure_str = ""
ylim = [0, .30]
mixed_trial_query = "data['list_type'] > 3"
control_trial_query = "data['list_type'] == 1"
control_shuffles = 10
min_lag = 4
max_lag = 3
use_lag2 = True
Code
project_root = find_project_root()
figure_dir = os.path.join(project_root, figure_dir)
data_path = os.path.join(project_root, data_path)
data = load_data(data_path)
trial_mask = generate_trial_mask(data, mixed_trial_query)
control_dataset = make_control_dataset(data, mixed_trial_query, control_trial_query, control_shuffles)
control_mask = generate_trial_mask(control_dataset, mixed_trial_query)
datasets = [data, control_dataset]
masks = [trial_mask, control_mask]
Code
for direction in ["j2i", "i2j", "both"]:
    plot_rep_neighbor_crp(
        datasets=datasets,
        trial_masks=masks,
        max_lag=max_lag,
        min_lag=min_lag,
        direction=direction,
        use_lag2=use_lag2,
        contrast_name="Source",
        labels=["Mixed", "Control"],
    )
    plt.title(f"Direction: {direction}")
    if ylim is not None:
        for ax in plt.gcf().axes:
            ax.set_ylim(ylim)
    save_figure(figure_dir, figure_str, suffix=direction)

Code
for direction in ["j2i", "i2j", "both"]:
    observed_crp = subject_rep_neighbor_crp(
        data, trial_mask, direction, use_lag2, min_lag, max_lag
    )
    control_crp = subject_rep_neighbor_crp(
        control_dataset, control_mask, direction, use_lag2, min_lag, max_lag
    )

    result = test_rep_neighbor_crp_vs_control(observed_crp, control_crp, max_lag, direction)

    print(f"\n{'='*70}")
    print(f"Statistical Test: {direction}")
    print(f"{'='*70}")
    if direction == "j2i":
        print("Tests whether j+1/j+2 → i-neighbors transitions are elevated vs control.")
        print("Significant positive effects support study-phase retrieval at P2.")
    elif direction == "i2j":
        print("Tests whether i+1/i+2 → j-neighbors transitions are elevated vs control.")
        print("(Control condition for asymmetric predictions.)")
    else:
        print("Tests both directions combined.")
    print()
    print(result)

======================================================================
Statistical Test: j2i
======================================================================
Tests whether j+1/j+2 → i-neighbors transitions are elevated vs control.
Significant positive effects support study-phase retrieval at P2.

Direction: j2i
  Lag |   t-stat    t p-val |   W-stat    W p-val |  Mean Diff
------+----------------------+----------------------+------------
   -3 |   -0.398     0.6929 |    245.0     0.2585 |    -0.0029
   -2 |   -0.005     0.9956 |    285.0     0.6330 |    -0.0000
   -1 |    2.082     0.0450 |    224.0     0.1397 |     0.0173
    0 |    0.392     0.6975 |    308.0     0.9163 |     0.0049
    1 |    0.813     0.4217 |    263.0     0.7545 |     0.0076
    2 |    2.198     0.0348 |    189.0     0.0390 |     0.0216
    3 |    1.016     0.3170 |    300.0     0.8146 |     0.0115

======================================================================
Statistical Test: i2j
======================================================================
Tests whether i+1/i+2 → j-neighbors transitions are elevated vs control.
(Control condition for asymmetric predictions.)

Direction: i2j
  Lag |   t-stat    t p-val |   W-stat    W p-val |  Mean Diff
------+----------------------+----------------------+------------
   -3 |    1.190     0.2421 |    247.0     0.2726 |     0.0165
   -2 |    0.874     0.3881 |    269.0     0.4609 |     0.0090
   -1 |    1.222     0.2301 |    269.0     0.4609 |     0.0130
    0 |    3.765     0.0006 |    118.0     0.0008 |     0.0594
    1 |    1.952     0.0593 |    217.0     0.1110 |     0.0188
    2 |    0.417     0.6793 |    312.0     0.9608 |     0.0038
    3 |   -1.322     0.1951 |    197.0     0.0533 |    -0.0103

======================================================================
Statistical Test: both
======================================================================
Tests both directions combined.

Direction: both
  Lag |   t-stat    t p-val |   W-stat    W p-val |  Mean Diff
------+----------------------+----------------------+------------
   -3 |    1.420     0.1646 |    231.0     0.1736 |     0.0107
   -2 |    0.744     0.4617 |    282.0     0.5988 |     0.0053
   -1 |    2.207     0.0342 |    201.0     0.0625 |     0.0138
    0 |    2.951     0.0057 |    150.0     0.0060 |     0.0301
    1 |    1.602     0.1185 |    230.0     0.1684 |     0.0105
    2 |    2.017     0.0516 |    209.0     0.0840 |     0.0120
    3 |   -0.373     0.7115 |    259.0     0.3678 |    -0.0027

Interpretation

Plots show transition probabilities between neighbors of different presentations. Key patterns:

  • Cross-occurrence facilitation: elevated transition probabilities between neighbors of different presentations indicate that recalling near one occurrence facilitates recall near the other.
  • Direction asymmetry: j2i vs. i2j differences reveal whether the direction of cross-occurrence transitions matters.
  • Observed vs. control: differences isolate repetition-specific neighbor effects beyond shuffled baselines.

API Details

Notebook parameters

  • data_path — path to an HDF5 file containing a RecallDataset.
  • figure_dir — directory for saving figures.
  • figure_str — base filename for the saved figure. Leave empty to display without saving.
  • ylim — y-axis limits, or None for automatic scaling.
  • mixed_trial_query — query selecting trials with repeated items.
  • control_trial_query — query selecting trials for the control.
  • control_shuffles — number of shuffle iterations for building the control dataset.
  • min_lag — minimum absolute lag included in the analysis.
  • max_lag — maximum absolute lag displayed.
  • use_lag2 — whether to include lag-2 neighbors in the analysis.