Code
import os
import matplotlib.pyplot as plt
import warnings
from jaxcmr.analyses.log_odds_crp import plot_log_odds_crp
from jaxcmr.helpers import find_project_root, generate_trial_mask, load_data, save_figure

warnings.filterwarnings("ignore")Baseline-correct temporal contiguity curves using log-odds transformation.
The log-odds CRP transforms standard conditional response probabilities into log-odds and subtracts a chosen reference lag to produce baseline-corrected contiguity curves. Positive values at a given lag indicate enrichment relative to the reference; negative values indicate suppression.
\[\text{logit}(p) = \log\!\left(\frac{p}{1-p}\right)\]
\[\Delta\text{LO}(\ell) = \text{logit}\bigl(\text{CRP}(\ell)\bigr) - \text{logit}\bigl(\text{CRP}(\ell_{\text{ref}})\bigr)\]
This representation is especially useful for lists with repeated items, where raw CRP values can be difficult to interpret due to varying availability.
import os
import matplotlib.pyplot as plt
import warnings
from jaxcmr.analyses.log_odds_crp import plot_log_odds_crp
from jaxcmr.helpers import find_project_root, generate_trial_mask, load_data, save_figure
warnings.filterwarnings("ignore")data_path = "data/LohnasKahana2014.h5"
figure_dir = "results/figures"
figure_str = ""
ylim = None
trial_query = "data['list_type'] == 1"
max_lag = 5
reference_lag = 10
epsilon = 1e-6
size = 3
confidence_level = 0.95project_root = find_project_root()
figure_dir = os.path.join(project_root, figure_dir)
data_path = os.path.join(project_root, data_path)
data = load_data(data_path)
trial_mask = generate_trial_mask(data, trial_query)plot_log_odds_crp(
data,
trial_mask,
max_lag=max_lag,
reference_lag=reference_lag,
epsilon=epsilon,
size=size,
confidence_level=confidence_level,
)
if ylim is not None:
for ax in plt.gcf().axes:
ax.set_ylim(ylim)
save_figure(figure_dir, figure_str)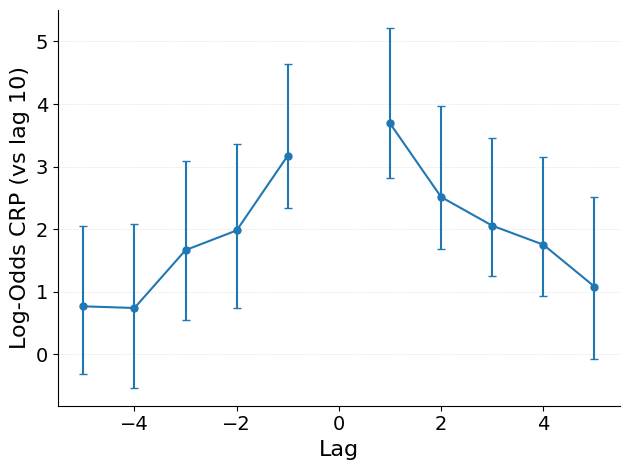
The x-axis shows serial lag and the y-axis shows log-odds relative to the reference lag. Key patterns:
data_path — path to an HDF5 file containing a RecallDataset.figure_dir — directory for saving figures.figure_str — base filename for the saved figure. Leave empty to display without saving.ylim — y-axis limits as a tuple, or None for automatic scaling.trial_query — a Python expression evaluated against the dataset to select trials.max_lag — maximum lag to display on the x-axis.reference_lag — the lag used as the zero baseline for log-odds subtraction.epsilon — small constant clamping CRP values away from 0 and 1 to avoid infinite log-odds.size — maximum number of study positions a single item can occupy.confidence_level — confidence level for subject-wise error bars.